Draws a (directed) Manhattan plot of p-values and versus e.g. retention time or mass-to-charge ratio. If effect size and direction is supplied, the - log10(p-value) on the y-axis will be multiplied by the direction (sign) of the effect, so part of the points will "drop" from the p = 1 (-log10(p) = 0) line. This results in a so-called directed Manhattan plot.
Usage
manhattan_plot(
  object,
  x,
  p,
  effect = NULL,
  p_fdr = NULL,
  color = NULL,
  p_breaks = c(0.05, 0.01, 0.001, 1e-04),
  fdr_limit = 0.05,
  x_lim = NULL,
  y_lim = NULL,
  color_scale = getOption("notame.color_scale_con"),
  title = "Manhattan plot",
  subtitle = NULL,
  ...
)

# S4 method for class 'MetaboSet'
manhattan_plot(
  object,
  x,
  p,
  effect = NULL,
  p_fdr = NULL,
  color = NULL,
  p_breaks = c(0.05, 0.01, 0.001, 1e-04),
  fdr_limit = 0.05,
  x_lim = NULL,
  y_lim = NULL,
  color_scale = getOption("notame.color_scale_con"),
  title = "Manhattan plot",
  subtitle = NULL,
  ...
)

# S4 method for class 'data.frame'
manhattan_plot(
  object,
  x,
  p,
  effect = NULL,
  p_fdr = NULL,
  color = NULL,
  p_breaks = c(0.05, 0.01, 0.001, 1e-04),
  fdr_limit = 0.05,
  x_lim = NULL,
  y_lim = NULL,
  color_scale = getOption("notame.color_scale_con"),
  title = "Manhattan plot",
  subtitle = NULL,
  ...
)

# S4 method for class 'SummarizedExperiment'
manhattan_plot(
  object,
  x,
  p,
  effect = NULL,
  p_fdr = NULL,
  color = NULL,
  p_breaks = c(0.05, 0.01, 0.001, 1e-04),
  fdr_limit = 0.05,
  x_lim = NULL,
  y_lim = NULL,
  color_scale = getOption("notame.color_scale_con"),
  title = "Manhattan plot",
  subtitle = NULL,
  ...
)
Arguments
- object
a
SummarizedExperiment,MetaboSetobject or a data frame. Feature data is used. If x is a data frame, it is used as is.- x, p
the column names of x-axis and p-values
- effect
column name of effect size (should have negative and positive values).
- p_fdr
column name of FDR corrected p-values, used to draw a line showing the fdr-corrected significance level
- color
column name used to color the plots
- p_breaks
a numerical vector of the p_values to show on the y-axis
- fdr_limit
the significance level used in the experiment
- x_lim, y_lim
numerical vectors of length 2 for manually setting the axis limits
- color_scale
the color scale as returned by a ggplot function
- title, subtitle
the title and subtitle of the plot
- ...
parameters passed to
geom_point, such as shape and alpha values. New aesthetics can also be passed usingmapping = aes(...).
Examples
data(example_set)
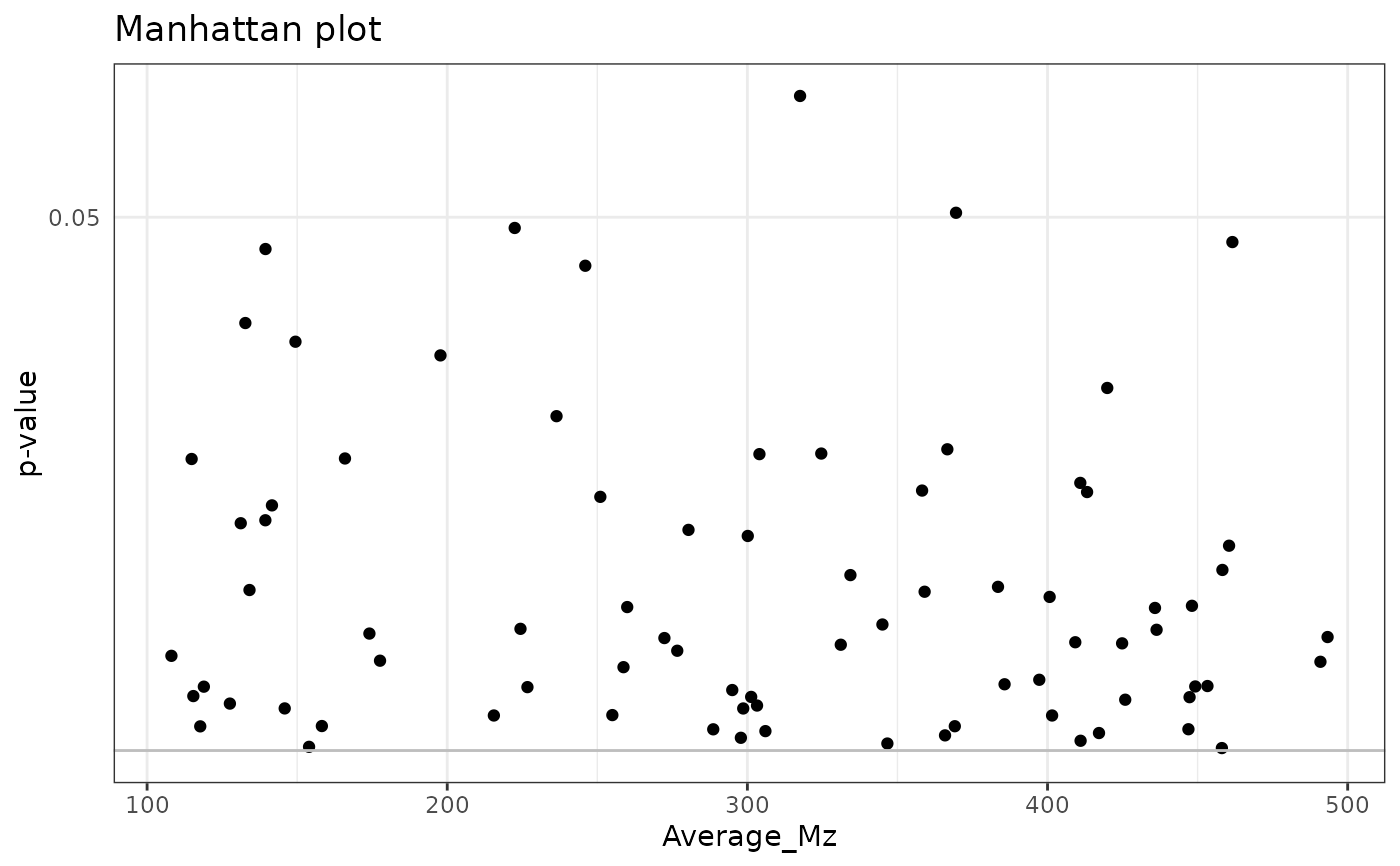
# naturally, this looks messy as there are not enough p-values
lm_results <- perform_lm(drop_qcs(example_set),
formula_char = "Feature ~ Group")
#> INFO [2025-06-23 22:36:43] Starting linear regression.
#> INFO [2025-06-23 22:36:44] Linear regression performed.
lm_data <- dplyr::left_join(as.data.frame(rowData(example_set)), lm_results)
#> Joining with `by = join_by(Feature_ID)`
# Traditional Manhattan plot from data frame
manhattan_plot(lm_data,
x = "Average_Mz",
p = "GroupB_P", p_fdr = "GroupB_P_FDR",
fdr_limit = 0.1
)
#> Warning: None of the FDR-adjusted p-values are below the significance level, not plotting the horizontal line.
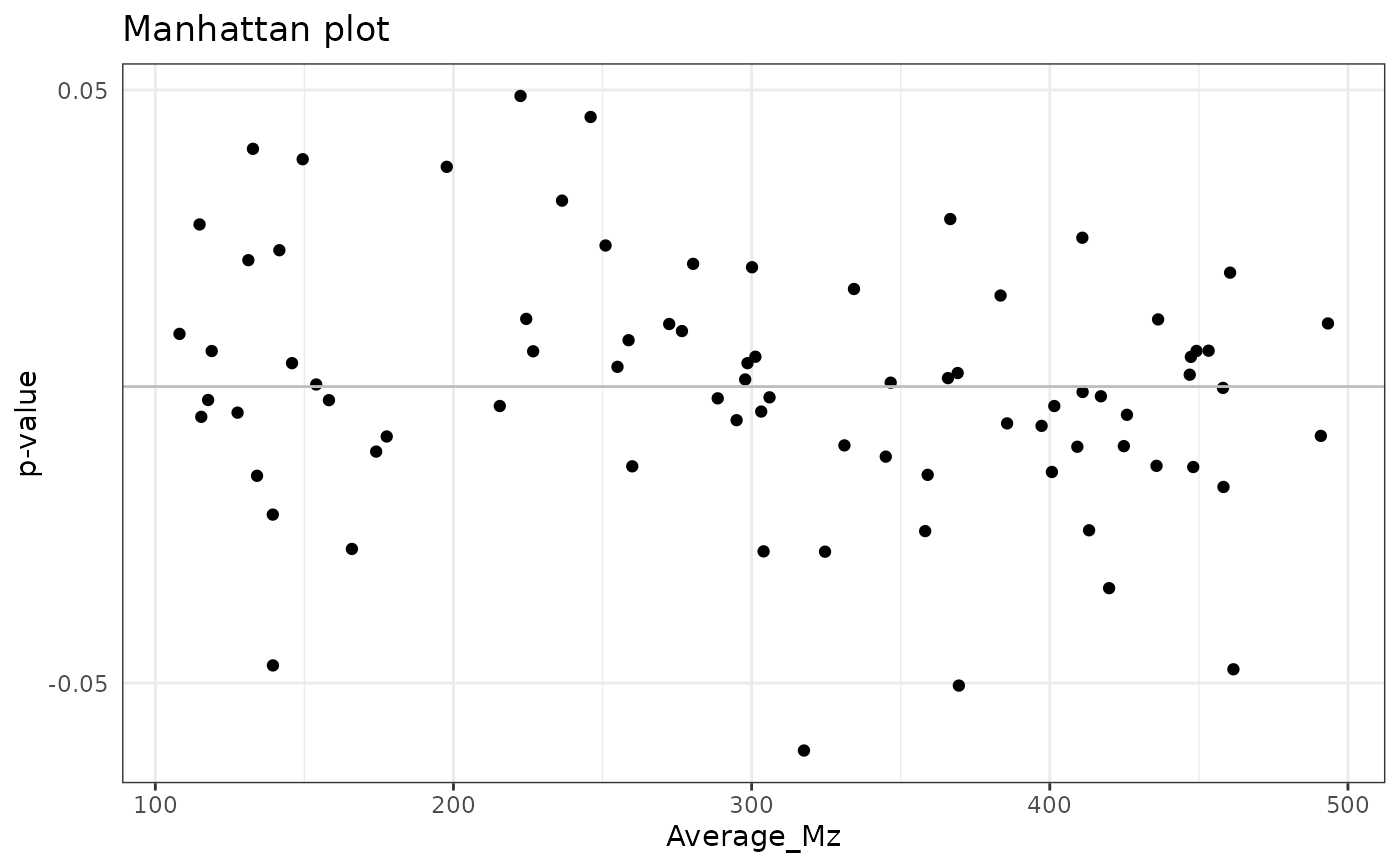
 # Directed Manhattan plot from SummarizedExperiment
with_results <- join_rowData(example_set, lm_results)
manhattan_plot(with_results,
x = "Average_Mz", effect = "GroupB_Estimate",
p = "GroupB_P", p_fdr = "GroupB_P_FDR",
fdr_limit = 0.1
)
#> Warning: None of the FDR-adjusted p-values are below the significance level, not plotting the horizontal line.
# Directed Manhattan plot from SummarizedExperiment
with_results <- join_rowData(example_set, lm_results)
manhattan_plot(with_results,
x = "Average_Mz", effect = "GroupB_Estimate",
p = "GroupB_P", p_fdr = "GroupB_P_FDR",
fdr_limit = 0.1
)
#> Warning: None of the FDR-adjusted p-values are below the significance level, not plotting the horizontal line.