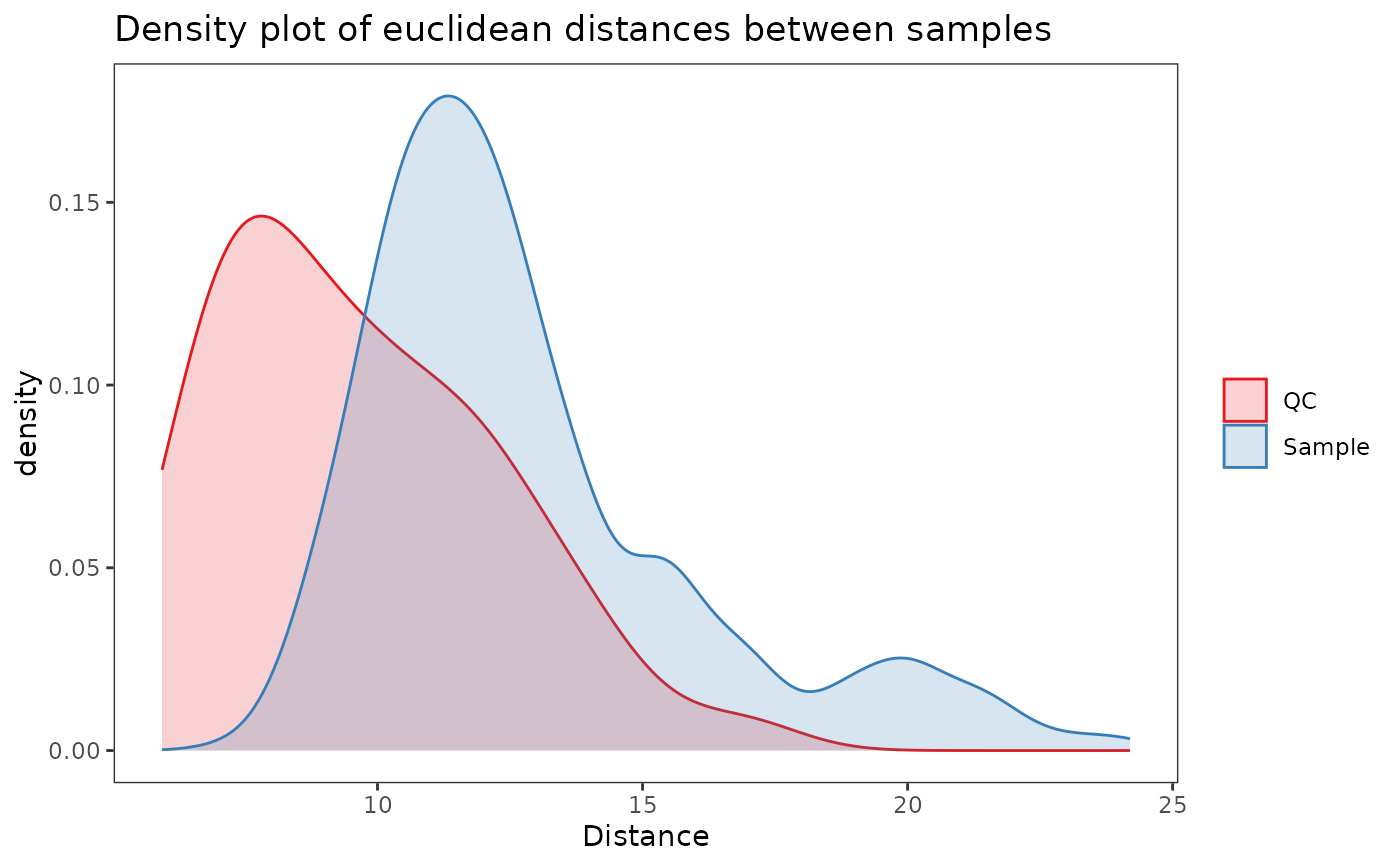
Plot density of distances between samples in QC samples and actual samples.
Usage
plot_dist_density(
  object,
  all_features = FALSE,
  dist_method = "euclidean",
  center = TRUE,
  scale = "uv",
  color_scale = getOption("notame.color_scale_dis"),
  fill_scale = getOption("notame.fill_scale_dis"),
  title = paste("Density plot of", dist_method, "distances between samples"),
  subtitle = NULL,
  assay.type = NULL
)
Arguments
- object
a
SummarizedExperimentorMetaboSetobject- all_features
logical, should all features be used? If FALSE (the default), flagged features are removed before visualization.
- dist_method
method for calculating the distances, passed to
dist- center
logical, should the data be centered?
- scale
scaling used, as in
prepDefault is "uv" for unit variance- color_scale
a scale for the color of the edge of density curves, as returned by a ggplot function
- fill_scale
a scale for the fill of the density curves, as returned by a ggplot function
- title
the plot title
- subtitle
the plot subtitle
- assay.type
character, assay to be used in case of multiple assays
Examples
data(example_set)
plot_dist_density(example_set)
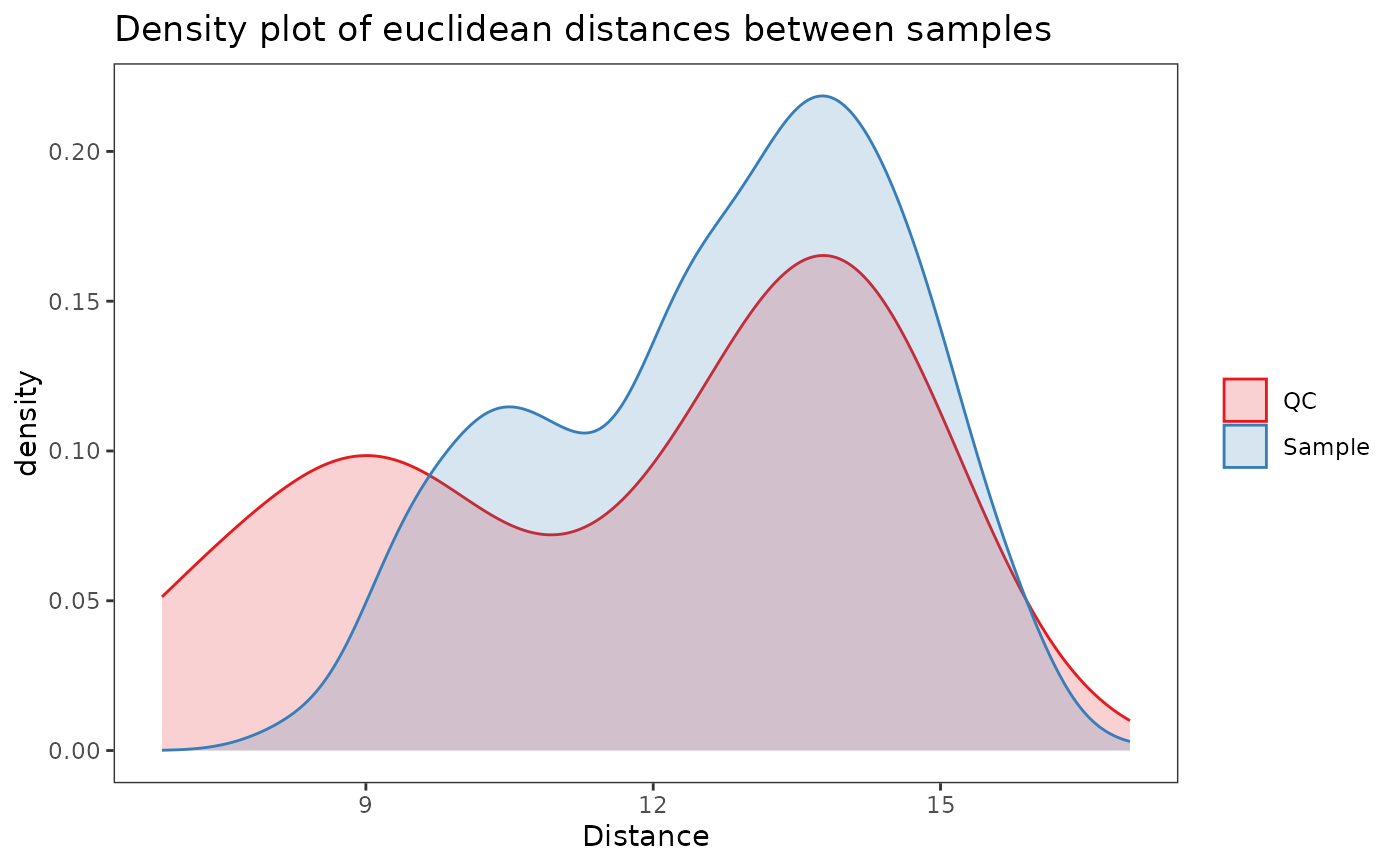 # Drift correction tightens QCs together
plot_dist_density(correct_drift(example_set))
#> INFO [2025-06-23 22:37:39]
#> Starting drift correction at 2025-06-23 22:37:39.926356
#> INFO [2025-06-23 22:37:39] Zero values in feature abundances detected. Zeroes will be replaced with 1.1.
#> INFO [2025-06-23 22:37:40] Drift correction performed at 2025-06-23 22:37:40.251752
#> INFO [2025-06-23 22:37:40] Inspecting drift correction results 2025-06-23 22:37:40.456545
#> INFO [2025-06-23 22:37:40] Drift correction results inspected at 2025-06-23 22:37:40.773323
#> INFO [2025-06-23 22:37:40]
#> Drift correction results inspected, report:
#> Drift_corrected: 100%
# Drift correction tightens QCs together
plot_dist_density(correct_drift(example_set))
#> INFO [2025-06-23 22:37:39]
#> Starting drift correction at 2025-06-23 22:37:39.926356
#> INFO [2025-06-23 22:37:39] Zero values in feature abundances detected. Zeroes will be replaced with 1.1.
#> INFO [2025-06-23 22:37:40] Drift correction performed at 2025-06-23 22:37:40.251752
#> INFO [2025-06-23 22:37:40] Inspecting drift correction results 2025-06-23 22:37:40.456545
#> INFO [2025-06-23 22:37:40] Drift correction results inspected at 2025-06-23 22:37:40.773323
#> INFO [2025-06-23 22:37:40]
#> Drift correction results inspected, report:
#> Drift_corrected: 100%