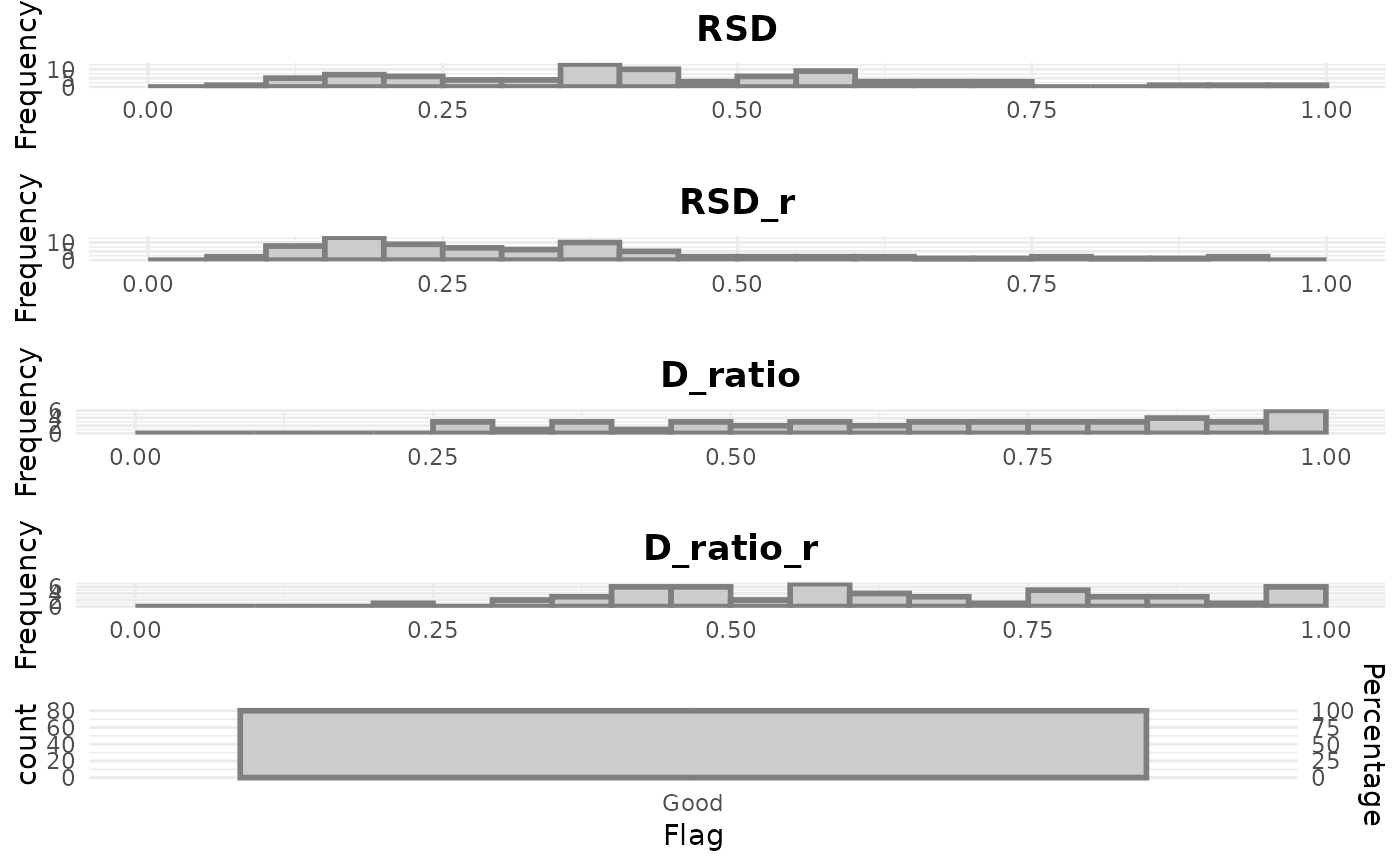
Plots distribution of each quality metric, and a distribution of the flags.
Arguments
- object
a
SummarizedExperimentorMetaboSetobject- all_features
logical, should all features be used? If FALSE (the default), flagged features are removed before visualization.
- plot_flags
logical, should the distribution of flags be added as a barplot?
- assay.type
character, assay to be used in case of multiple assays and no quality metrics are present in feature data
Examples
data(example_set)
plot_quality(example_set)
#>
#> Quality metrics not found, computing them now