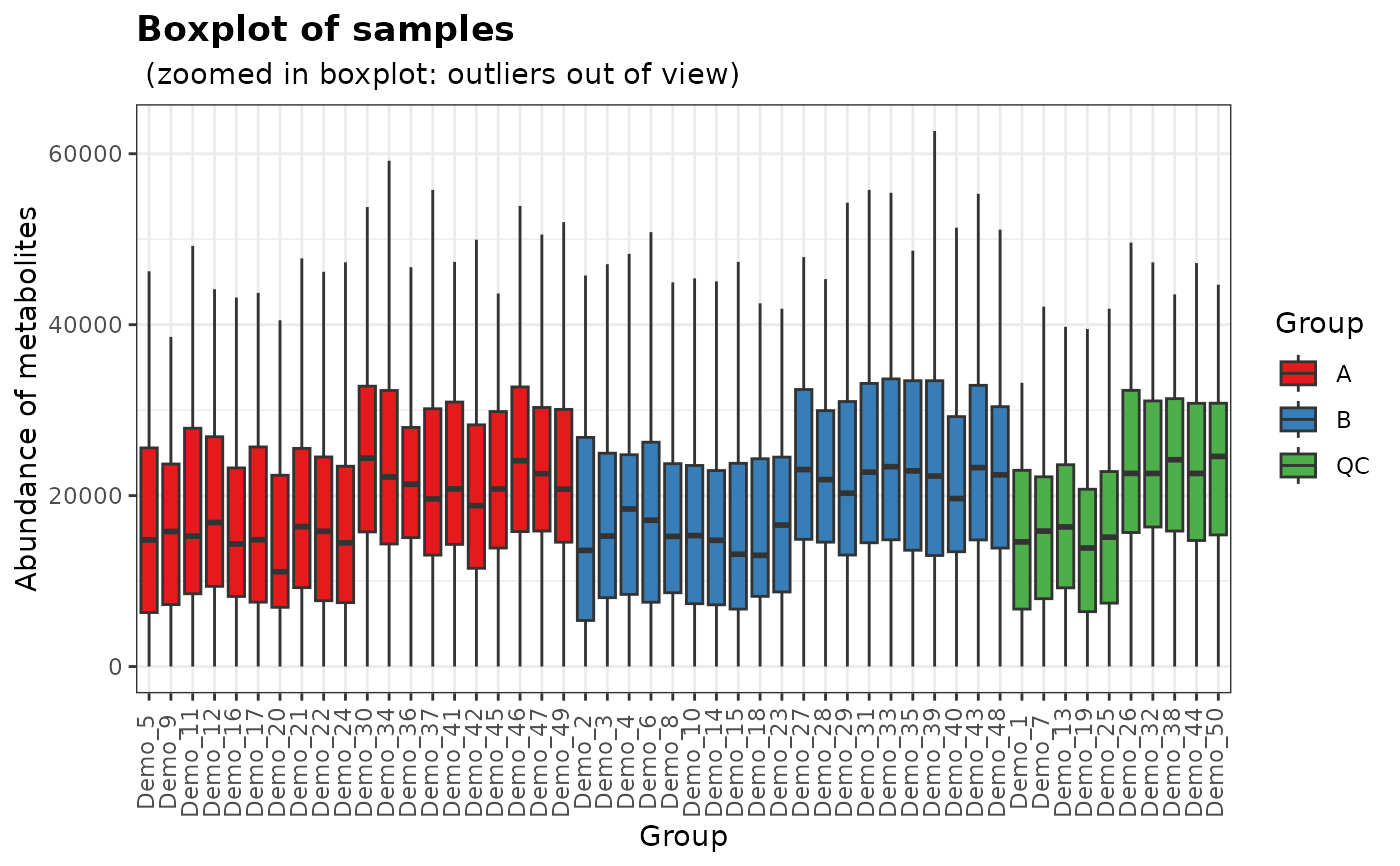
Plots a boxplot of the distribution of the metabolite values for each sample. The boxplots can be ordered and filled by any combination of columns in the pheno data. By default, order and fill are both determined by the combination of group and time columns.
Usage
plot_sample_boxplots(
  object,
  all_features = FALSE,
  order_by,
  fill_by,
  title = "Boxplot of samples",
  subtitle = NULL,
  fill_scale = getOption("notame.fill_scale_dis"),
  zoom_boxplot = TRUE,
  assay.type = NULL
)
Arguments
- object
a
SummarizedExperimentorMetaboSetobject- all_features
logical, should all features be used? If FALSE (the default), flagged features are removed before visualization.
- order_by
character vector, names of columns used to order the samples
- fill_by
character vector, names of columns used to fill the boxplots
- title, subtitle
character, title and subtitle of the plot
- fill_scale
a scale for the fill of the boxplots, as returned by a ggplot function
- zoom_boxplot
logical, whether outliers should be left outside the plot and only the boxplots shown. Defaults to TRUE.
- assay.type
character, assay to be used in case of multiple assays
Examples
data(example_set)
plot_sample_boxplots(example_set, order_by = "Group", fill_by = "Group")