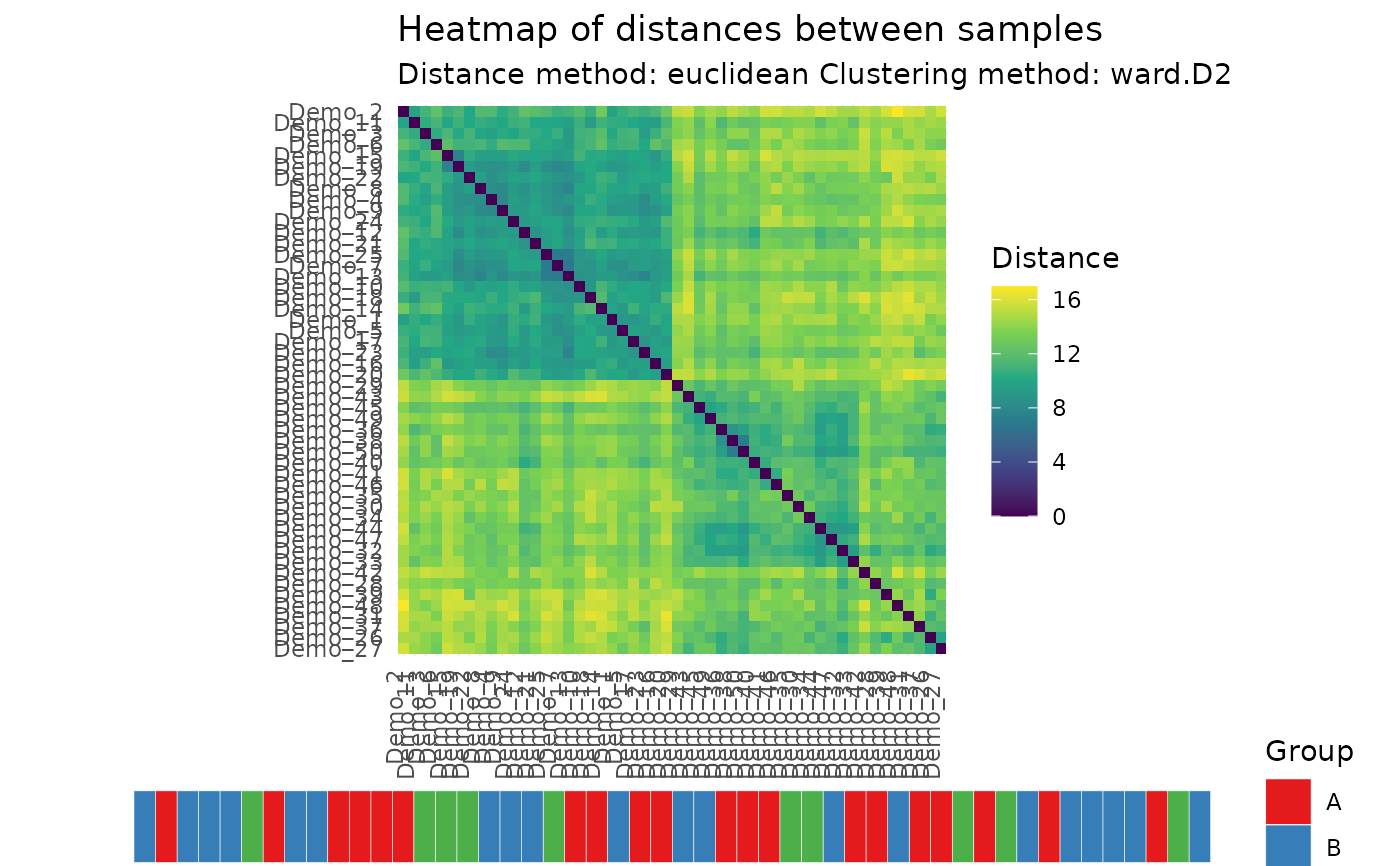
Draws a heatmap of the distances between the samples of an experiment, the samples are ordered by hierarchical clustering.
Usage
plot_sample_heatmap(
  object,
  all_features = FALSE,
  dist_method = "euclidean",
  clust_method = "ward.D2",
  center = TRUE,
  scale = "uv",
  group_bar = TRUE,
  group = NULL,
  title = "Heatmap of distances between samples",
  subtitle = NULL,
  fill_scale_con = getOption("notame.fill_scale_con"),
  fill_scale_dis = getOption("notame.fill_scale_dis"),
  assay.type = NULL
)
Arguments
- object
a
SummarizedExperimentorMetaboSetobject- all_features
logical, should all features be used? If FALSE (the default), flagged features are removed before visualization.
- dist_method
distance method used in clustering as in
dist- clust_method
method used in clustering as in
hclust- center
logical, should the data be centered?
- scale
scaling used, as in
prep. Default is "uv" for unit variance- group_bar
logical, should a bar showing the groups be drawn under the heat map?
- group
character, name of the column used for coloring the group bar
- title
The plot title
- subtitle
The plot subtitle
- fill_scale_con
Continuous fill scale for the heatmap as returned by a ggplot function
- fill_scale_dis
Discrete fill scale for the group bar as returned by a ggplot function
- assay.type
character, assay to be used in case of multiple assays
Value
A ggplot object. If group_bar is TRUE, the plot will
consist of multiple parts and is harder to modify.
Examples
data(example_set)
plot_sample_heatmap(example_set, group = "Group")