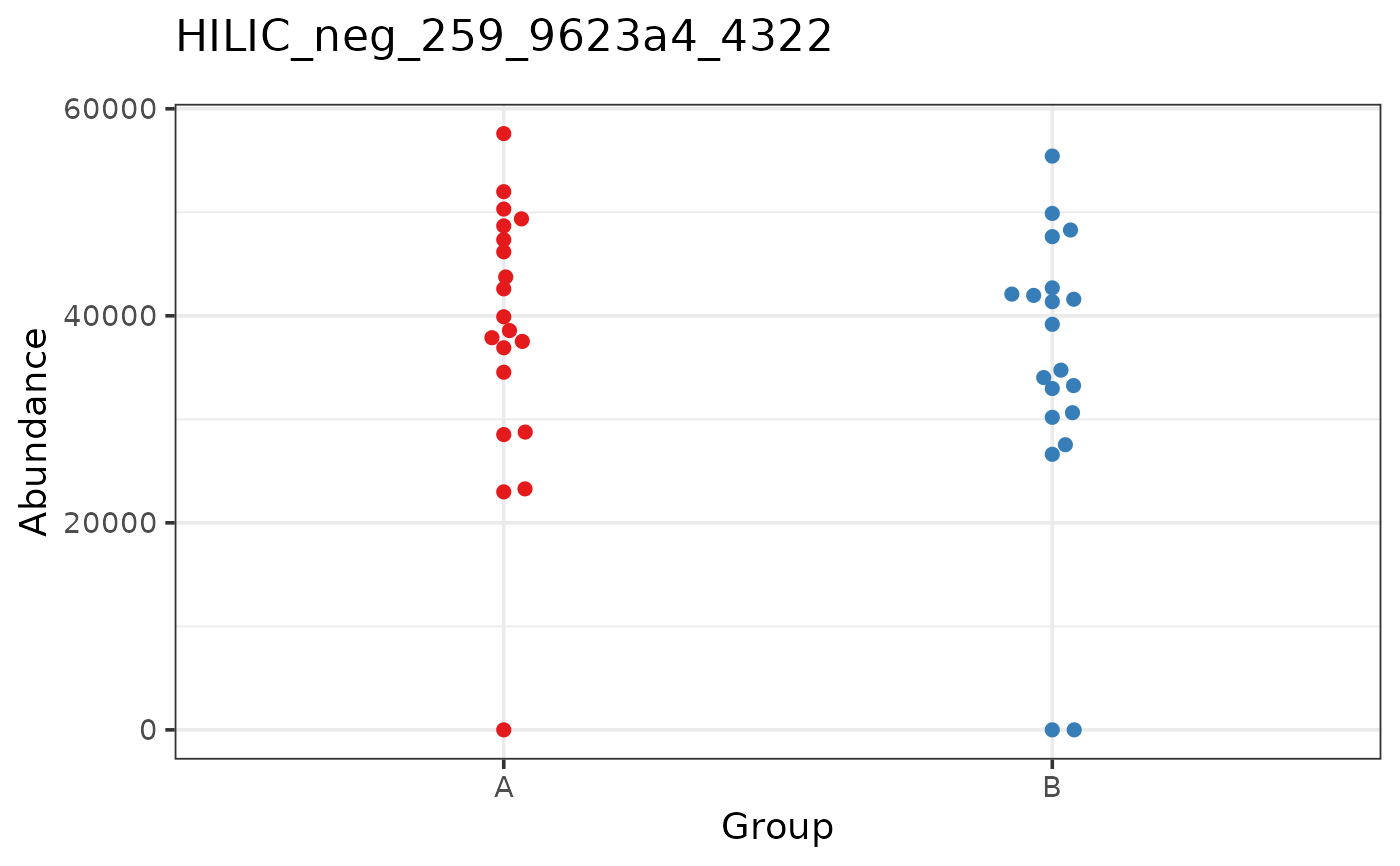
Draws a beeswarm plot of feature abundances in each group. A separate plot is drawn and saved for each feature.
Usage
save_beeswarm_plots(
  object,
  all_features = FALSE,
  save = TRUE,
  file_path = NULL,
  format = "emf",
  x,
  add_boxplots = FALSE,
  title = "Feature_ID",
  subtitle = NULL,
  color,
  color_scale = getOption("notame.color_scale_dis"),
  text_base_size = 14,
  cex = 2,
  size = 2,
  title_line_length = 40,
  theme = theme_bw(base_size = text_base_size),
  assay.type = NULL,
  ...
)
Arguments
- object
a
SummarizedExperimentorMetaboSetobject- all_features
logical, should all features be used? If FALSE (the default), flagged features are removed before visualization.
- save
logical, if false, the plots are not saved but returned as a list
- file_path
character, a file path for PDF or prefix added to the file paths for other formats
- format
character, format in which the plots should be saved
- x
character, name of the column to be used as x-axis
- add_boxplots
logical, should boxplots be added to the figure?
- title, subtitle
column names from feature data to use as plot title/filename and subtitle. Set to NULL for no title/subtitle, this creates running numbered filenames
- color
character, name of the column to be used for coloring
- color_scale
the color scale as returned by a ggplot function
- text_base_size
integer, base size for text in figures
- cex
numeric, scaling for adjusting point spacing
- size
numeric, size of points
- title_line_length
integer, maximum length of the title line in characters, passed to
str_wrap- theme
a ggplot theme to be added to the plot
- assay.type
character, assay to be used in case of multiple assays
- ...
other arguments to graphic device functions, like width and height
Value
By default, the function is invoked for its plot-saving side effect.
The function returns a list of plots when save = FALSE.
Examples
data(example_set)
# Default beeswarms by group
save_beeswarm_plots(drop_qcs(example_set)[1:10],
  file_path = "./beeswarm_plots.pdf",
  format = "pdf", x = "Group", color = "Group"
)
#> INFO [2025-06-23 22:38:17] Saved beeswarm plots to: ./beeswarm_plots.pdf
# x and color can be a different variable
save_beeswarm_plots(drop_qcs(example_set)[1:10],
  file_path = "./beeswarm_plots/",
  format = "png",
  x = "Time",
  color = "Group"
)
#> INFO [2025-06-23 22:38:17] Saved to: ./beeswarm_plots/HILIC_neg_259_9623a4_4322.png
#> INFO [2025-06-23 22:38:17] Saved to: ./beeswarm_plots/HILIC_neg_108_1065a2_6121.png
#> INFO [2025-06-23 22:38:17] Saved to: ./beeswarm_plots/HILIC_neg_158_23a1_4128.png
#> INFO [2025-06-23 22:38:18] Saved to: ./beeswarm_plots/HILIC_neg_251_0056a0_6161.png
#> INFO [2025-06-23 22:38:18] Saved to: ./beeswarm_plots/HILIC_neg_401_52a4_211.png
#> INFO [2025-06-23 22:38:18] Saved to: ./beeswarm_plots/HILIC_neg_400_7045a5_3842.png
#> INFO [2025-06-23 22:38:18] Saved to: ./beeswarm_plots/HILIC_neg_304_014a7_1311.png
#> INFO [2025-06-23 22:38:18] Saved to: ./beeswarm_plots/HILIC_neg_276_6328a2_7734.png
#> INFO [2025-06-23 22:38:18] Saved to: ./beeswarm_plots/HILIC_neg_118_9111a4_1865.png
#> INFO [2025-06-23 22:38:18] Saved to: ./beeswarm_plots/HILIC_neg_446_9413a2_315.png
#> INFO [2025-06-23 22:38:18] Saved beeswarm plots to: ./beeswarm_plots/

# Plot one feature
save_beeswarm_plots(drop_qcs(example_set)[1, ], save = FALSE, x = "Group",
color = "Group")
#> Just a remainder, creating a long list of plots takes a lot of memory!
#> [[1]]

#>
#>