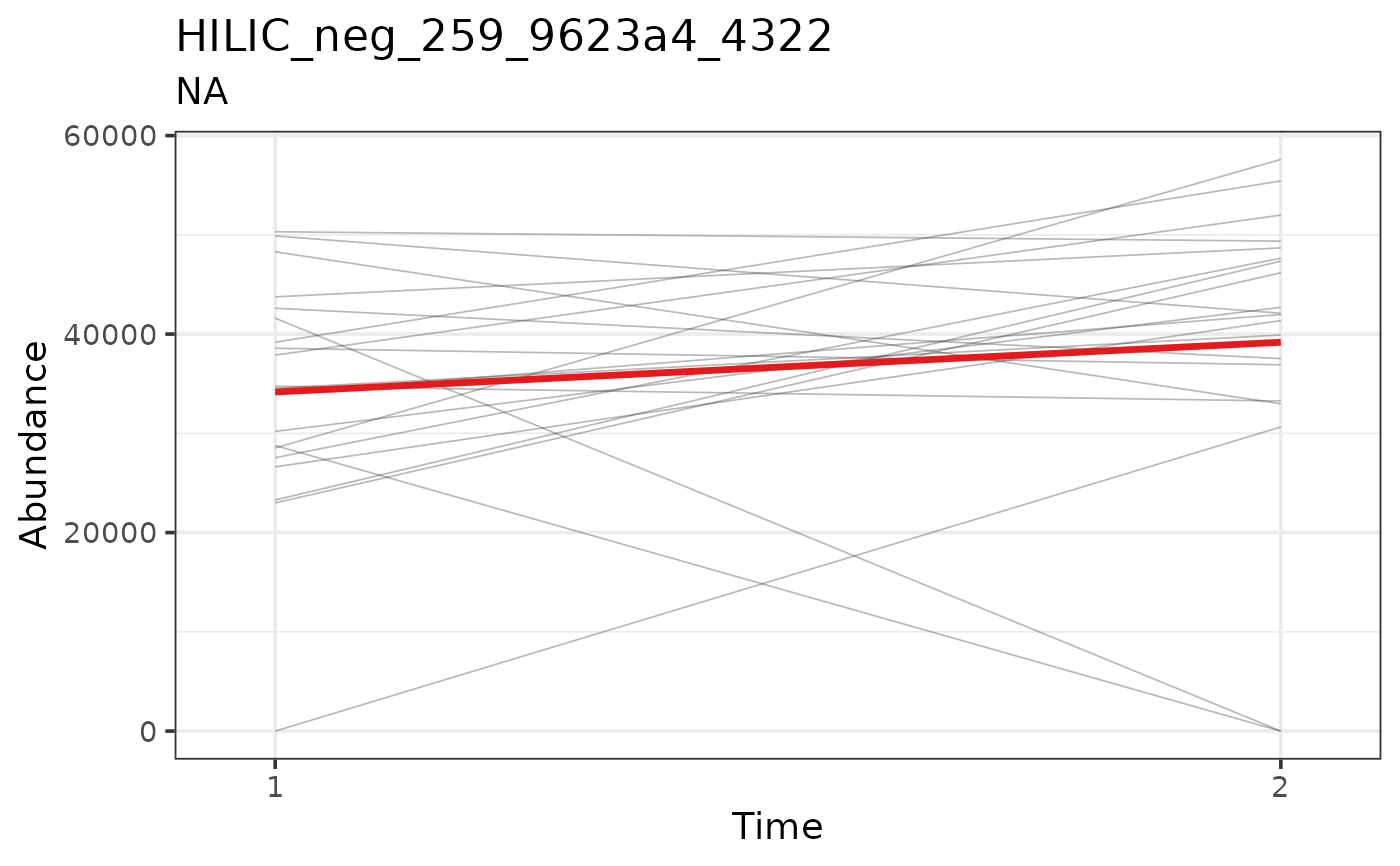
Plots the change in the feature abundances as a function of e.g. time. A line is drawn for each subject and a mean line is added. A separate plot is drawn and saved for each feature.
Usage
save_subject_line_plots(
  object,
  all_features = FALSE,
  save = TRUE,
  file_path = NULL,
  format = "emf",
  x,
  id,
  title = "Feature_ID",
  subtitle = NULL,
  color = NULL,
  color_scale = getOption("notame.color_scale_dis"),
  facet = NULL,
  text_base_size = 14,
  line_width = 0.3,
  mean_line_width = 1.2,
  title_line_length = 40,
  theme = theme_bw(base_size = text_base_size),
  assay.type = NULL,
  ...
)
Arguments
- object
a
SummarizedExperimentorMetaboSetobject- all_features
logical, should all features be used? If FALSE (the default), flagged features are removed before visualization.
- save
logical, if false, the plots are not saved but returned as a list
- file_path
character, a file path for PDF or prefix added to the file paths for other formats
- format
character, format in which the plots should be saved
- x
character, name of the column to be used as x-axis
- id
character, name of the column containing subject IDs
- title, subtitle
column names from feature data to use as plot title/filename and subtitle. Set to NULL for no title/subtitle, this creates running numbered filenames
- color
character, the column name to color the lines by (optional)
- color_scale
the color scale as returned by a ggplot function
- facet
character, the column name to facet by (optional, usually same as color)
- text_base_size
integer, base size for text in figures
- line_width
numeric, width of the lines
- mean_line_width
numeric, width of the mean line
- title_line_length
integer, maximum length of the title line in characters, passed to
str_wrap- theme
a ggplot theme to be added to the plot
- assay.type
character, assay to be used in case of multiple assays
- ...
other arguments to graphic device functions, like width and height
Value
By default, the function is invoked for its plot-saving side effect.
The function returns a list of plots when save = FALSE.
Examples
data(example_set)
save_subject_line_plots(drop_qcs(example_set)[1:10], x = "Time",
  id = "Subject_ID", file_path = "./subject_line_plots.pdf",
  format = "emf", title = NULL)
#> Switching to PDF format based on file path
#> INFO [2025-06-23 22:38:31] Saved line plots with mean line to: ./subject_line_plots.pdf

# Plot one feature
save_subject_line_plots(drop_qcs(example_set[1, ]), save = FALSE, x = "Time",
  id = "Subject_ID")
#> Just a remainder, creating a long list of plots takes a lot of memory!
#> [[1]]

#>
#>