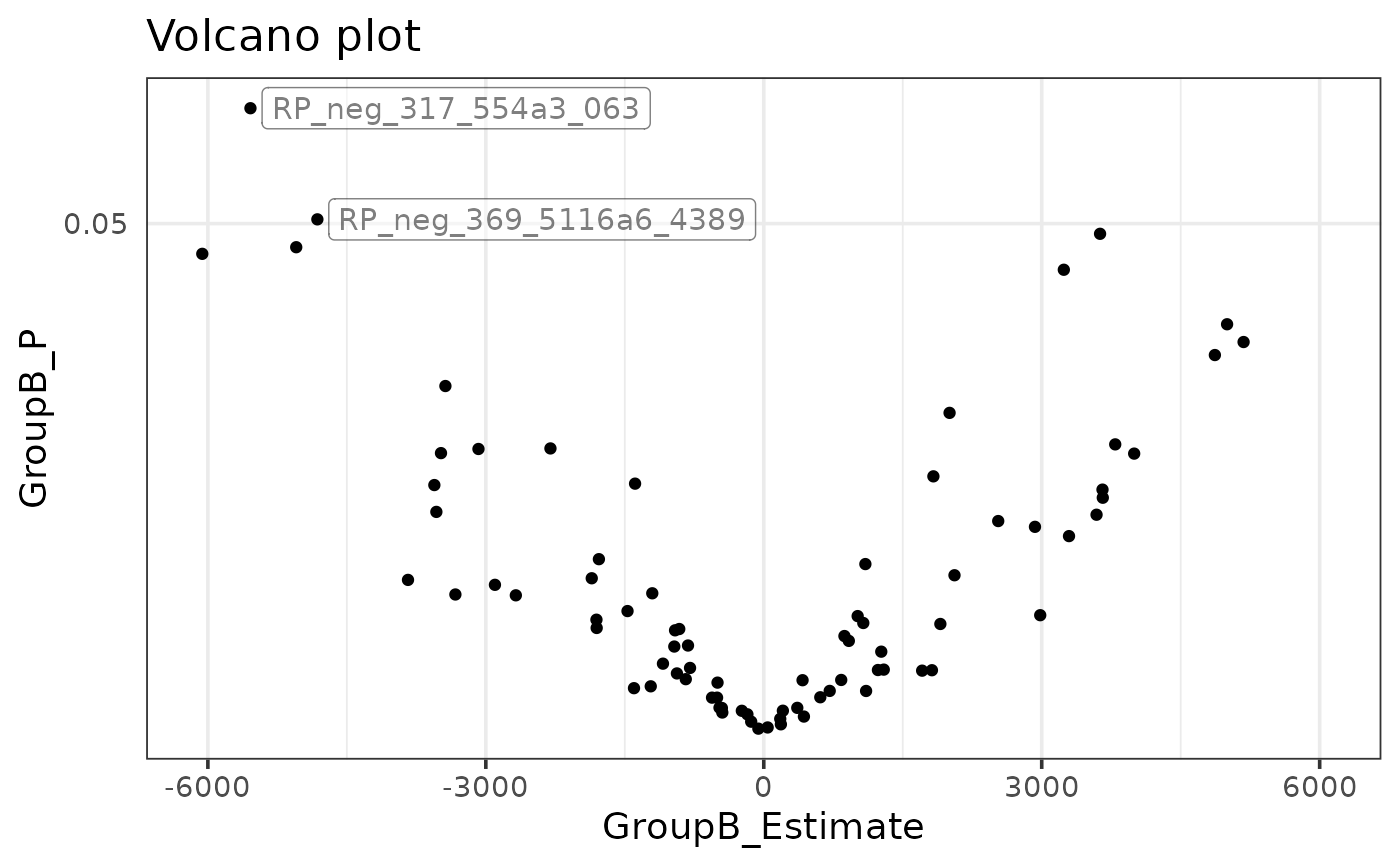
Draws a volcano plot of effect size and p-values.
Usage
volcano_plot(
  object,
  x,
  p,
  p_fdr = NULL,
  color = NULL,
  p_breaks = c(0.05, 0.01, 0.001, 1e-04),
  fdr_limit = 0.05,
  log2_x = FALSE,
  center_x_axis = TRUE,
  x_lim = NULL,
  label = NULL,
  label_limit = 0.05,
  color_scale = getOption("notame.color_scale_con"),
  title = "Volcano plot",
  subtitle = NULL,
  text_base_size = 14,
  label_text_size = 4,
  ...
)

# S4 method for class 'MetaboSet'
volcano_plot(
  object,
  x,
  p,
  p_fdr = NULL,
  color = NULL,
  p_breaks = c(0.05, 0.01, 0.001, 1e-04),
  fdr_limit = 0.05,
  log2_x = FALSE,
  center_x_axis = TRUE,
  x_lim = NULL,
  label = NULL,
  label_limit = 0.05,
  color_scale = getOption("notame.color_scale_con"),
  title = "Volcano plot",
  subtitle = NULL,
  text_base_size = 14,
  label_text_size = 4,
  ...
)

# S4 method for class 'data.frame'
volcano_plot(
  object,
  x,
  p,
  p_fdr = NULL,
  color = NULL,
  p_breaks = c(0.05, 0.01, 0.001, 1e-04),
  fdr_limit = 0.05,
  log2_x = FALSE,
  center_x_axis = TRUE,
  x_lim = NULL,
  label = NULL,
  label_limit = 0.05,
  color_scale = getOption("notame.color_scale_con"),
  title = "Volcano plot",
  subtitle = NULL,
  text_base_size = 14,
  label_text_size = 4,
  ...
)

# S4 method for class 'SummarizedExperiment'
volcano_plot(
  object,
  x,
  p,
  p_fdr = NULL,
  color = NULL,
  p_breaks = c(0.05, 0.01, 0.001, 1e-04),
  fdr_limit = 0.05,
  log2_x = FALSE,
  center_x_axis = TRUE,
  x_lim = NULL,
  label = NULL,
  label_limit = 0.05,
  color_scale = getOption("notame.color_scale_con"),
  title = "Volcano plot",
  subtitle = NULL,
  text_base_size = 14,
  label_text_size = 4,
  ...
)
Arguments
- object
a
SummarizedExperiment,MetaboSetobject or a data frame. Feature data is used. If x is a data frame, it is used as is.- x, p
the column names of effect size (x-axis) and p-values
- p_fdr
column name of FDR corrected p-values, used to draw a line showing the fdr-corrected significance level
- color
column name used to color the plots
- p_breaks
a numerical vector of the p_values to show on the y-axis
- fdr_limit
the significance level used in the experiment
- log2_x
logical, whether effect size should be plotted on a log2 axis.
- center_x_axis
logical, whether x-axis should be centered. If
TRUE, the "zero-effect" will be on the middle of the plot. The "zero effect" is 0 iflog2_x = FALSEand 1 iflog2_x = TRUE- x_lim
numerical vector of length 2 for manually setting the x-axis limits
- label
column name used to label the plots
- label_limit
numeric, p-value which is used to limit label plotting. Defaults to 0.05.
- color_scale
the color scale as returned by a ggplot function
- title, subtitle
the title and subtitle of the plot
- text_base_size
integer, base size for text in figures
- label_text_size
numeric, size of the labels
- ...
parameters passed to
geom_point, such as shape and alpha values. New aesthetics can also be passed usingmapping = aes(...).
Examples
data(example_set)
# naturally, this looks messy as there are not enough p-values
lm_results <- perform_lm(drop_qcs(example_set),
  formula_char = "Feature ~ Group")
#> INFO [2025-06-23 22:38:41] Starting linear regression.
#> INFO [2025-06-23 22:38:41] Linear regression performed.
volcano_plot(lm_results,
  x = "GroupB_Estimate",
  p = "GroupB_P", p_fdr = "GroupB_P_FDR",
  label = "Feature_ID",
  fdr_limit = 0.1
)
#> Warning: None of the FDR-adjusted p-values are below the significance level, not plotting the horizontal line.