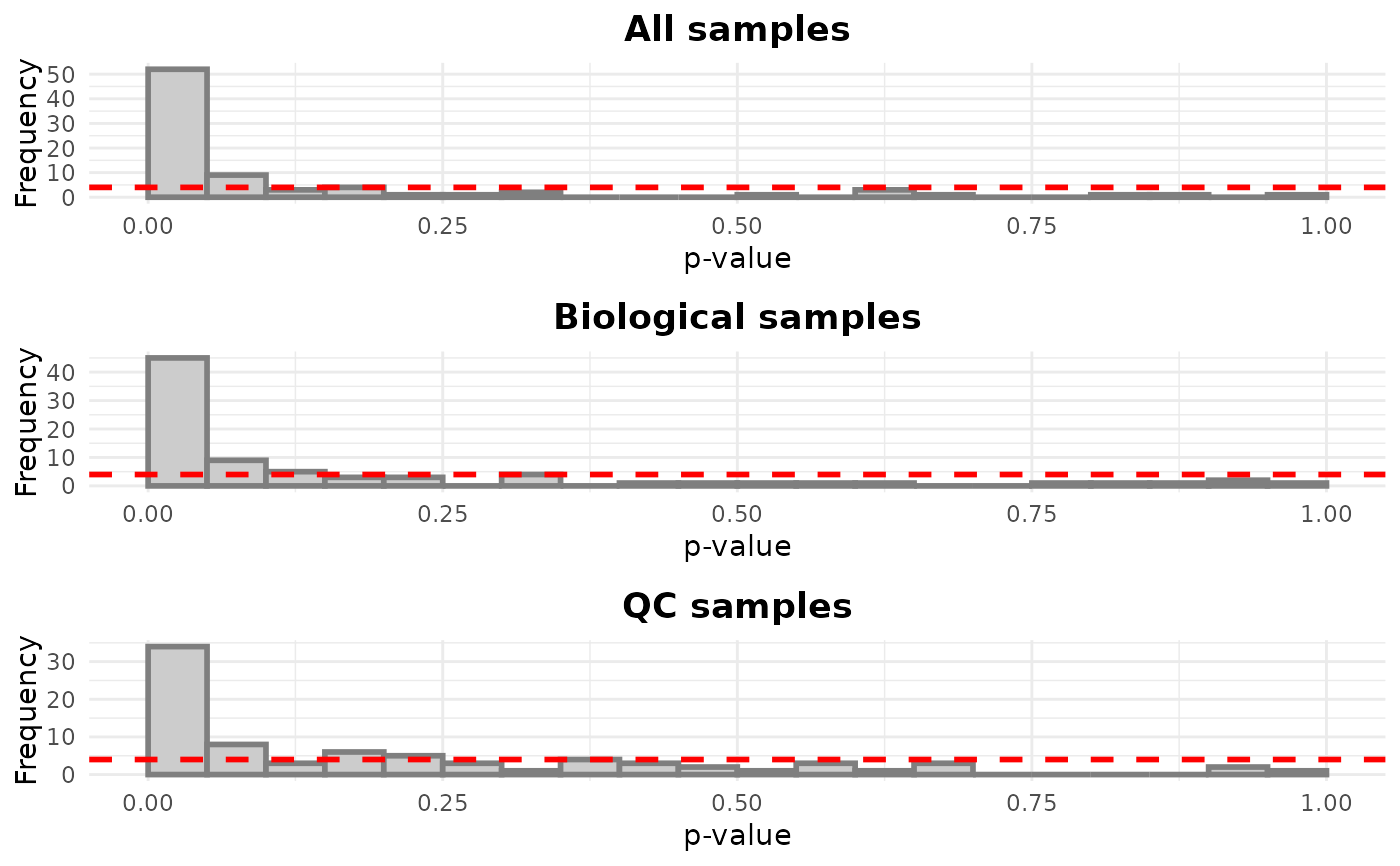
Plots histograms of p-values from linear regression model, where each feature is predicted by injection order alone. The expected uniform distribution is represented by a dashed red line.
Arguments
- object
a
SummarizedExperimentorMetaboSetobject- all_features
logical, should all features be used? If FALSE (the default), flagged features are removed before visualization.
- assay.type
character, assay to be used in case of multiple assays
Examples
data(example_set)
plot_injection_lm(example_set)
#> INFO [2025-06-23 22:37:44] Starting linear regression.
#> INFO [2025-06-23 22:37:45] Linear regression performed.
#> INFO [2025-06-23 22:37:45] Starting linear regression.
#> INFO [2025-06-23 22:37:45] Linear regression performed.
#> INFO [2025-06-23 22:37:45] Starting linear regression.
#> INFO [2025-06-23 22:37:46] Linear regression performed.